In Pierre-Jules Stahl’s words,”Science consists of a series of observations” (Miscellaneous Thoughts and Reflections, 1841). Thus, to understand glasshouses culture in Kuujjuaq, one must first observe and measure.
As part of the successive SEQUINEQ projects, we therefore undertook various measurements to try to understand the thermal behaviour of the community greenhouse.
Constraints
We had some constraints, which were imposed on us or that we are imposed on ourselves.
Among the constraints imposed, we had the extreme climate [source] with temperatures measured between 31.5 and -41.9°C! This requires some precautions to be taken to protect the electronics! Secondly, we had to prevent possible power outages and Internet connection failures. Indeed, we didn’t want to lose any information!
The constraints we imposed on ourselves mainly concerned the measurements to be carried out and the near real-time transmission to our French laboratory. For the measurements, we wanted the classic outdoor and greenhouse temperatures and hygrometry. We also wanted to measure the available solar resource and the ground temperature of the greenhouse. Finally, we wanted a daily photograph of the inside of the greenhouse so that we could follow the growth of the plants.
We also wanted a (relatively) simple, inexpensive solution based on royalty-free solutions to enable sharing to the community.
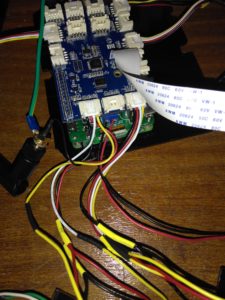
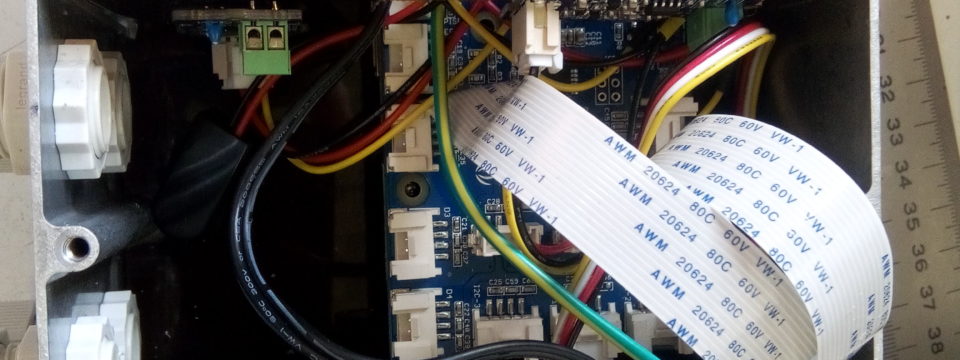
The whole thing had to be imagined, built and tested on the other side of the Atlantic. We had to be sure of our realization, because any remote maintenance would be problematic and would require human intervention! Not to mention the fact of taking the plane and therefore to pass the security checks with the prototype that you can admire in the photograph below!!
The solutions
We opted for a solution based on raspberryPi 3 [source] which is a microcomputer running on Linux, with enough power for our application… and costing less than 50€.

Given the different constraints we had, we broke down our system into two parts:
- The “master” box is located in the “Centre de Recherche du Nunavik” and has the role of receiving the data transmitted by the “slave” box and then transmitting it via the Internet to our laboratory;
- The “slave” box (located in the greenhouse) carries out the measurements and transmits the information to the “master” once a day.
The master-slave transmission is performed through a wi-fi connection over a distance of about 300m. We had to modify the Rapsberry by soldering on it and connecting a suitable external antenna. Despite this precaution, nothing can be done to ensure that the connection is always established: the slave box therefore stores the measured data locally until reception is confirmed by the master.
Each box also has an external component that monitors the power supply and stops the system cleanly in case of a power failure. When power returns, it is also responsible for rebooting the system.
And what now?
The device has been running since September 2017, and it keeps transmitting data… from time to time! We receive the data for almost every day, but often several days after the measurement date. The good news is that the synchronization procedure seems to work (not “too much” data loss). The less good news is that at the moment it needs human intervention regularly!
However, we have learned a lot and are now working on a new version that will improve the reliability of the data transmission and add some new sensors (notably the CO2 content inside the greenhouse). We also need to work on sharing data through the website.
Even if it can be perfected, we have a system that allows us to remotely monitor a horticultural greenhouse (or others for that matter) and to remotely retrieve the measurements for analysis.
We hope to be able to share it so that we can gather information on as many greenhouses as possible to feed our research work on optimizing the energy efficiency of horticultural greenhouses!
So don’t hesitate to contact us!
